Debugging 101
A how-to guide on code debugging techniques.
"If debugging is the process of removing software bugs, then programming must be the process of putting them in."
~ Edsger W. Dijkstra
"Nobody can write perfect code every single time. You will make errors" warned my Computer Science lecturer. Not that I doubted him, but he couldn't have been more correct.
As you grow as a programmer you learn to fix bugs faster. However, starting out it can be frustrating to debug code through lack of experience and understanding of techniques. I've interacted with a lot of junior developers where the only technique that they use is guessing. They read over their code line-by-line and blindly make small changes hoping it will fix the issue that they're facing. The aim of this post is to cover a range of techniques that you can use to identify the source of bugs quicker.
On your marks... Get set... DEBUG!
Proactivity
You may have arrived at this blog post because you're stuck with your code and need help with specific techniques. The next section will help you with this, but it's good to know how to be proactive to minimise future bugs and the time spent identifying their origin. Designing your software using the SOLID principles will make your software more understandable, flexible and maintainable. A deep dive is slightly outside the scope of this post but a high-level overview is described below.
SOLID Software
SOLID is a mnemonic acronym and prescribes the following guidelines:
- Single responsibility principle - A class should have only a single responsibility
- Open/closed principle - A classes behaviour should be able to extended without being modified
- Liskov substitution principle - Derived classes must be substitutable for their base classes
- Interface segregation principle - Multiple interfaces with a specific purpose are better than one general-purpose interface
- Dependency inversion principle - Create a dependency on abstractions, not other modules
A few of these principles are described below in greater detail.
"With good program architecture debugging is a breeze, because bugs will be where they should be."
~ David May
Decouple Code
Decoupling code is the practice of creating a modular system whereby a component is not tightly intertwined with other areas. Creating tightly coupled code could introduce more bugs faster. For example if Class A heavily depends on Class B and Class B changes, then Class A could break or produce incorrect results. Decoupling is a pattern often seen in microservice architecture and uses a concept called 'encapsulation' to prevent tight coupling.
Well-Defined Interfaces
Interfaces are one of the most important software engineering concepts and describes the contract between a system and an environment. It makes you think about the functionality required as well as the inputs and outputs of the code. Restricting functionality of code based on the interfaces that they implement will give the separation of concern required to be able to home in on any bugs that appear.
Write Unit Tests
Unit tests can (and should) be written to verify that individual units of code/components are functioning as expected. Most IDE's can be configured to run tests whenever code is built and can be a quick and easy way to determine which unit of code is not functioning as expected. Taking the practice of writing unit tests one step further would be to incorporate tests from the very beginning using test driven development. Designing your program by writing the tests first can catch bugs very early.
Techniques
Debugging can take many forms. To get to the bottom of an issue I normally use a combination depending on how desperate I'm getting.
Rubber Ducking
Possibly the best named yet the least known is a technique called 'rubber ducking'. The name is a reference to a story in the book The Pragmatic Programmer by Andy Hunt and Dave Thomas in which a programmer would carry around a rubber duck and debug his code by forcing himself to explain it, line-by-line, to the duck. If the programmer was unable to do so then it's clear that they don't understand what is happening, or they will have a moment of clarity. If you don't have a duck, then grab the person sitting next to you! Normally in doing so, a lot of the time you arrive at the solution yourself before they can answer you.
A lot of people, including my place of employment, have rubber ducks on the desk sat waiting to be talked to. Of course in reality nobody (read - normal people) sits talking to ducks in the office. It's merely tokenistic and a nod to this method of debugging and development, but it's a widely adopted method. And it works!
Stepping Through With Breakpoints
Whether you're debugging in an IDE or a browser, using breakpoints and stepping through code line-by-line is a very useful method of identifying where issues in the code lie.
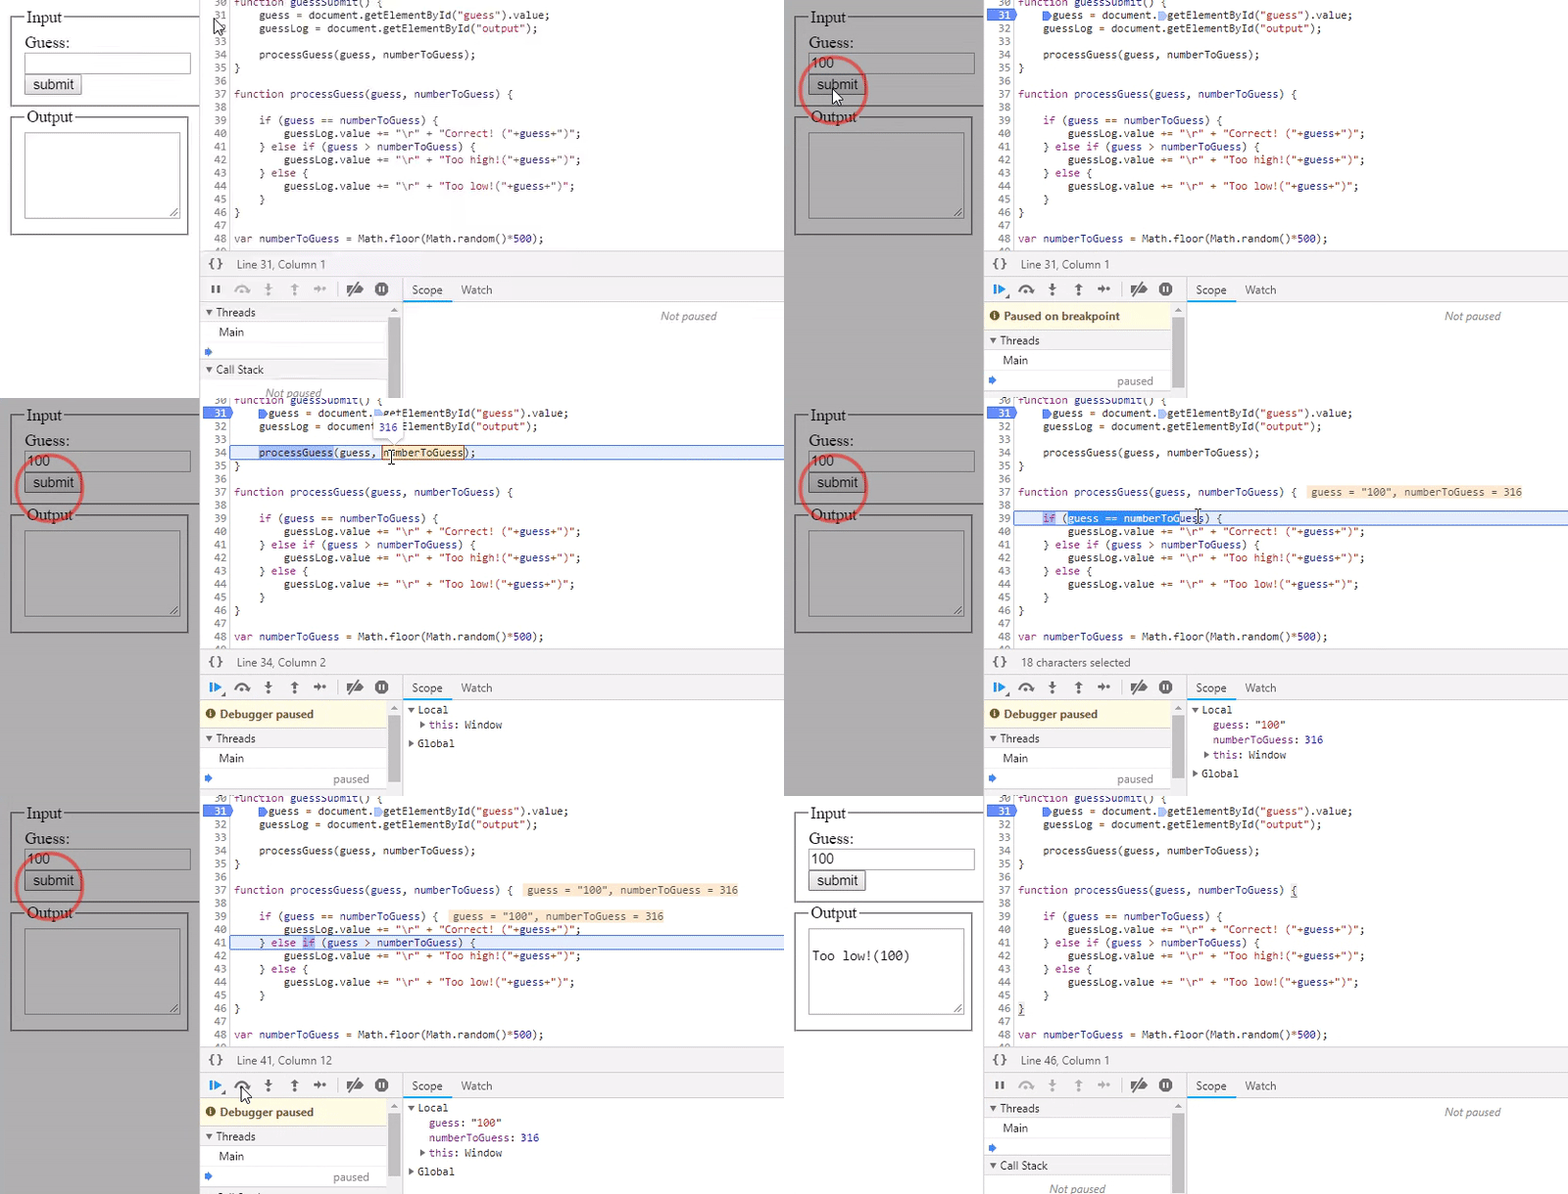
Most modern IDE's and browsers allow you to pause execution on a line of code and will show you the value of the variables and expressions as they change or which line is causing the program to crash. Below I've demonstrated this method with a simple number guessing game.
The above demonstrates the result of rolling over variables in a debugger after the code has paused at a break-point (signified by the blue block in the margin). Stepping through the code using the 'step over' button, and the 'step into' button to go deeper into function calls will give you the visibility that you need to discover what is happening to your code line-by-line.
Log Printing
Code is like the ocean; you can't turn your back on it. The unfortunate truth is that your application could be long-running and you may not be around when it crashes or behaves unexpectedly. You'll want to do your future-self a favor and leave appropriate log statements in your code to print important events. An example is when an exception is thrown along with information leading up to that point. Oh, and timestamp those suckers. Your code may be multi-threaded and examining the timings of the logs could be paramount.
Controlling the levels is an important aspect of logging, and getting it wrong could mean the difference between thousands of unwanted/useless log lines in your log files. The log levels generally range descending in severity from FATAL > ERROR > WARN > INFO > DEBUG > TRACE.
They are normally used in the following way:
log.trace('TRACE LOG!') - Fine grained information about every step of a routine. Examples include inputs and outputs.
log.debug('DEBUG LOG!') - Information useful to many different types of users such as developers, analysts, sysadmins.
log.info('INFO LOG!') - Information that is nice to have but not cared about for normal analysis. Examples include connections, service stops, starts, database closes.
log.warn('WARN LOG!') - Strange or unwanted behavior in the code but nothing that it can't recover from. Examples include missing optional config or high memory usage.
log.error('ERROR LOG!') - Something has gone wrong in the code and the current operation is in jeopardy. The wider application is still OK though. Examples include incorrect login details or an aborted transaction.
log.fatal('FATAL LOG!') Something has gone VERY wrong in the code and the wider application is in jeopardy or has died. Examples include corruption or data loss.
Log configs will allow you to control what is shown in the log files. If FATAL is turned on, it will display only FATAL. If TRACE is turned on, everything will be displayed. This pattern can be followed down the chain to know what each level will show.
Divide and Conquer
Let's play a game. I'm thinking of a number between 1 and 100. What number am I thinking of?
The best way to approach this is obviously to ask if the number is greater than or equal to 50. The answer will tell you which way to divide the range in half and then ask the question again until you zone in on the number. You could of course brute-force this and take wild guesses but this is the formulaic way to on average arrive at the correct number.
Now... imagine that number is the line of code containing the bug. Using the above method of breakpoints or log statements, identify the scope that the bug could be in (whole code-base, module, component etc...). Look in the middle of this scope. Has the error materialized by this point? Half the coding range in the appropriate direction. Zone in on the error. This method is particularly useful if you're new to a code-base and aren't too familiar with how it works.
Post-Mortem
To reiterate, you may not be around when your code breaks. Or be able to reproduce the bug easily. What can you do? You wait for it to crash and examine the output. This will normally take the form of a stack trace or a memory dump. It contains a snapshot of the program at the point of breaking such as the specific exceptions thrown for example ArgumentNullException or hopefully something as equally descriptive. This is often shown with the line numbers of all of the function calls leading up to the exception which could prove to be very useful for identifying the origin of the bug.
Debugging is a necessary part of software development and you will have to do it at some point or another. Probably all of the time. Hopefully now you're better informed of some of the many techniques to examine your code closer but there is lots more you can do to minimize the pain later on. Remember the golden rule: Execute your program after every 2-3 lines of code. Debug often; one bug at a time.


